Video: Building a PR and CI Triage Dashboard. It was recorded on a made-up repo, acme-co/storefront, so none of the PRs, people, or code in it are real.
As a company we are moving away from using Graphite. GitHub does stacked PRs natively now, and stacking was the reason we started using Graphite. Fair enough. I like Graphite's UI for stacked PRs… not sure about GitHub's yet. But, the one feature I was going to miss was the code tour.
I didn't need a new tool for it, though. I already had a dashboard I open every morning, and it just needed one more button.
How the dashboard happened
It started with failing CI. I wanted to see if an agent could fix CI failures for me, so I kept handing one the same commands: pull the failing checks, read the logs, try a fix. I've gotten into a habit with that kind of thing. If I do something a couple of times, it becomes a swamp model method, an extension, or a workflow. I share as many of those as I can.
The same thing happened with review comments on my own PR stacks. Have an agent look at the stack, triage the comments coming in, draft replies, and make quick fixes. Agents are pretty good at the lint and formatting ones.
Then it turned into a deterministic swamp workflow. Rather than starting with an agent, a scheduled swamp workflow reaches out to GitHub, pulls my PRs and their comments, and only goes down an agent route when something needs one. For a long time all of that ran without a screen. As I had more and more going on, I wanted to see the status of it all, so it got a GUI.
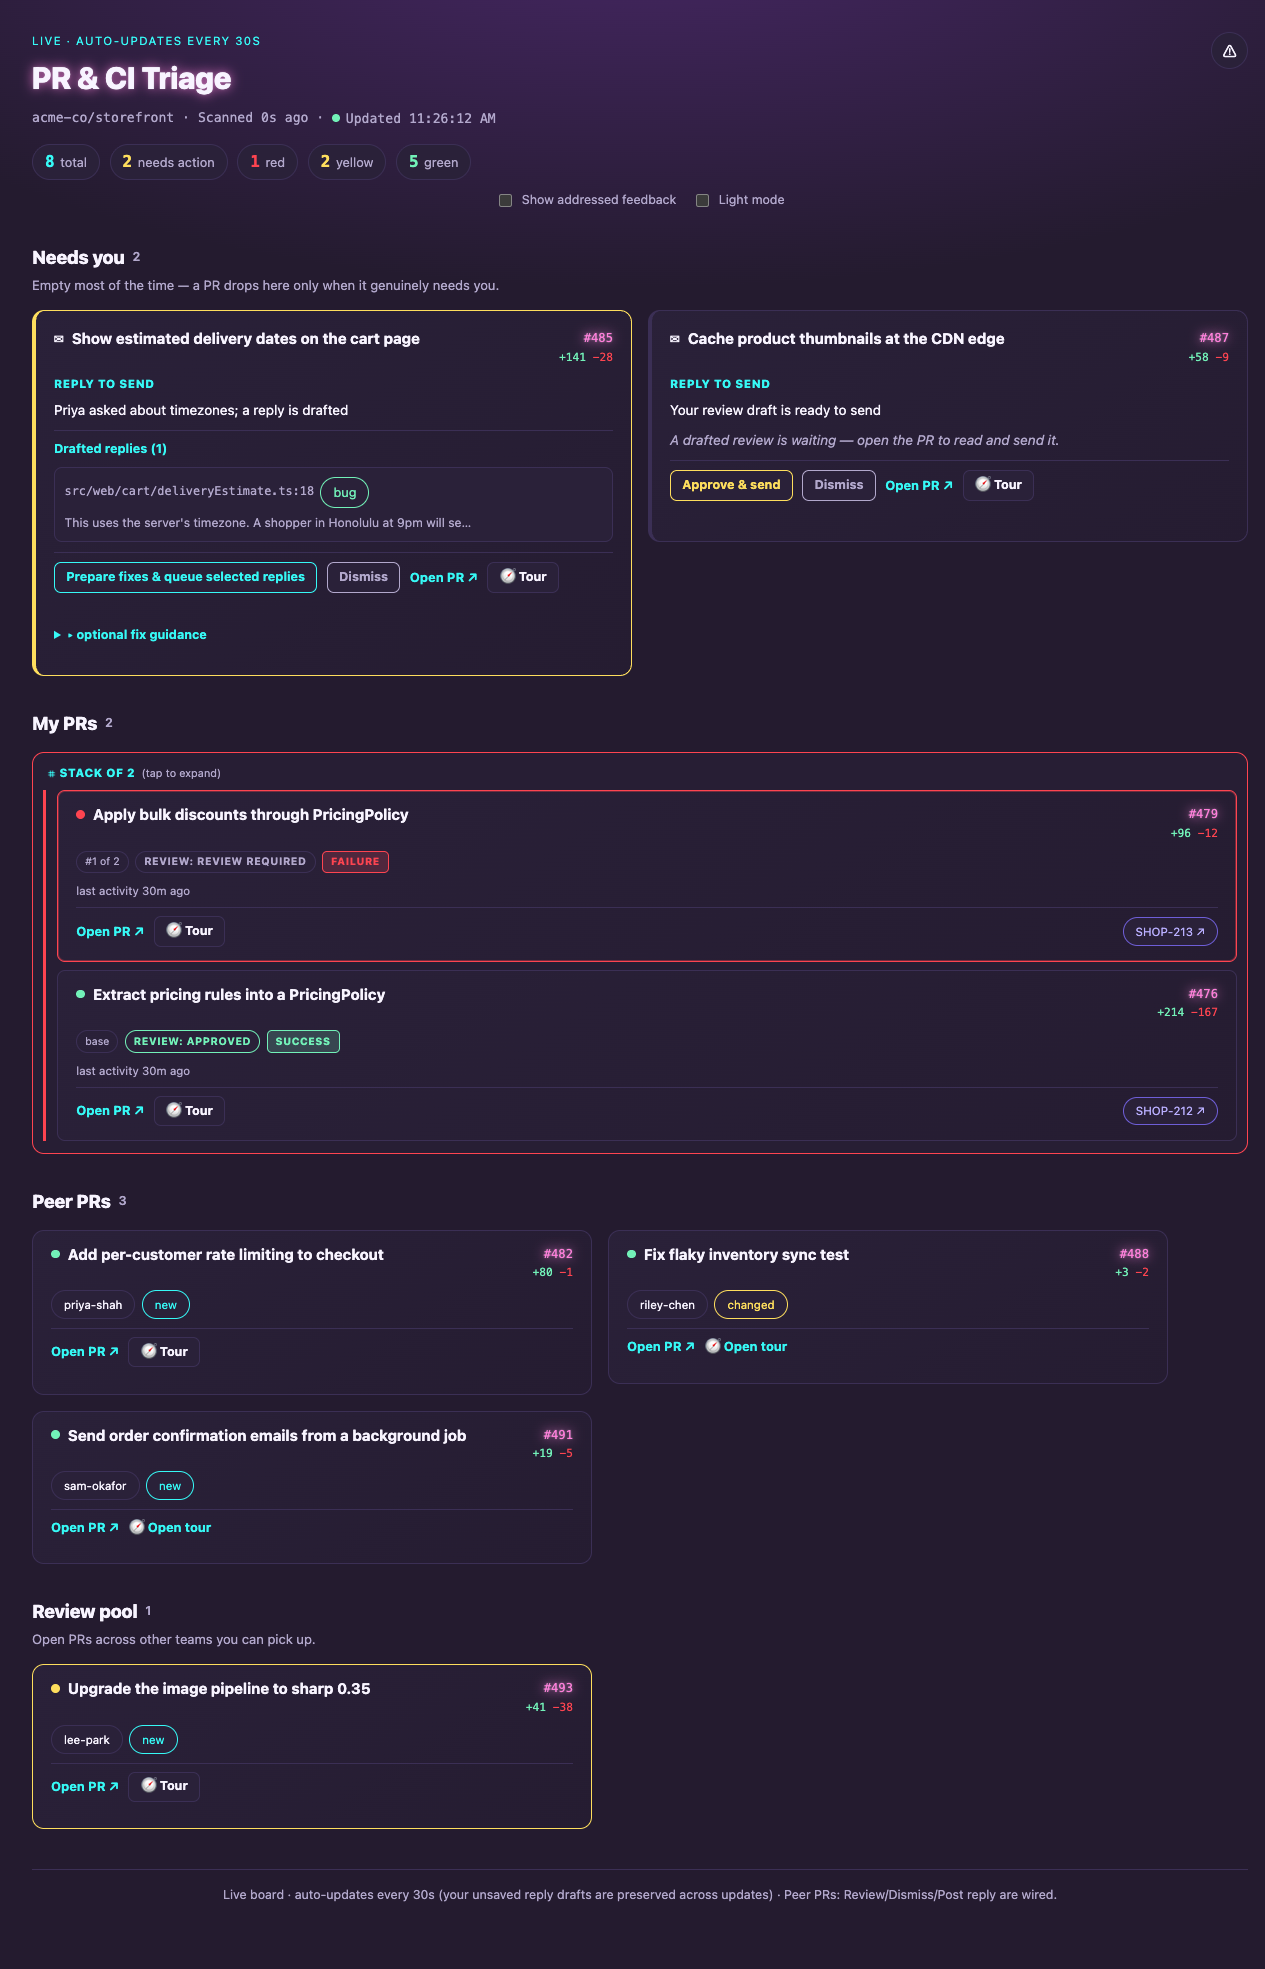
It has four sections:
- Needs you: a PR lands here only when it actually needs me: a comment waiting on a reply, or a fix waiting for my OK. Most of the time this section is empty, and that's on purpose.
- My PRs: everything I have open, grouped by stack, with CI state, review state, linked Linear issues, and
+N −Mso I know how big each one is. Stacks started back when I was using Graphite for them. - Peer PRs: my team's open PRs, so I can see what's waiting on my review.
- Review pool: every other open PR I could get involved in. Mostly for keeping a pulse on things.
The demo only has a handful of PRs. My real one has a lot more, and that's the whole reason the dashboard exists.
Replying to review comments
When someone leaves a comment on my PR, the scheduled run has already drafted a reply and, where it makes sense, a sketch of the fix. I can see the comment, the diff hunk it's on, and what the agent wants to say.
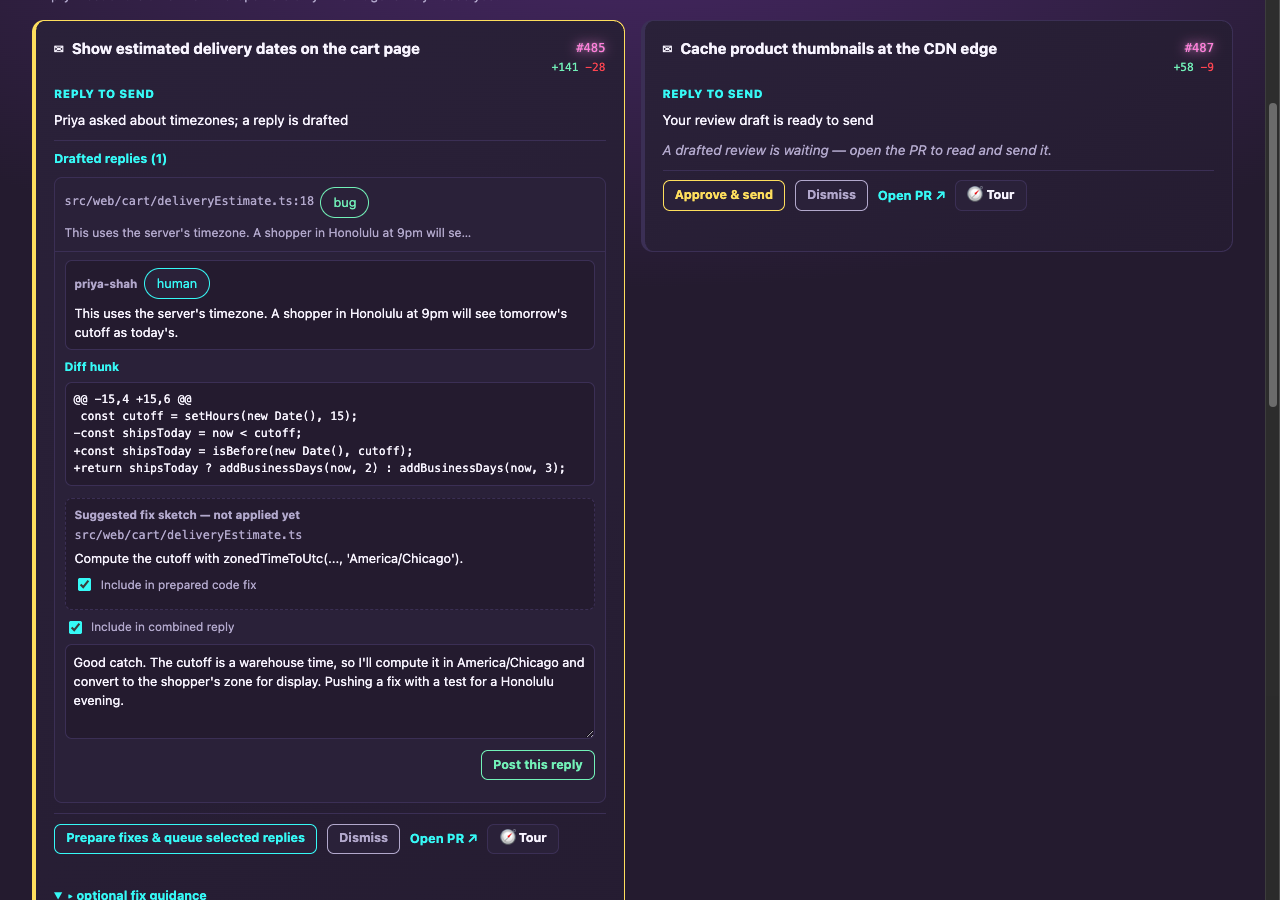
The draft is usually way too wordy, as agents tend to be. So I cut it down to something like "Good catch, I'll fix this," keep the fix checked, and hit Prepare fixes & queue selected replies. It prepares the fix and shows me the whole thing one more time. Then I approve it, and it posts the reply and pushes the fix.
For small things, like a lint failure or formatting, I've come to the point where I let it fix CI on its own.
Graphite Tour Mode
I still like Graphite a lot. One of my favorite features was the PR tour. It doesn't walk a PR file by file. It walks it by idea, trying to show how the changes in different files connect. The same file shows up several times in a tour, cut into the pieces that belong to each step of the story.
I use it for my peers' code. I use it for my own code too, which surprised me. Agents write my code now, and iterate on it, and run browser checks, and go through all these loops before I ever see it. I'm not at the point where I can just say "go" and ship. I still need to review that code. One of the hardest things for me is looking at code and building an intuition for what's going on, and tours help with that more than anything else I've tried.
So the tour, not the stacks, was what I wanted to keep from Graphite.
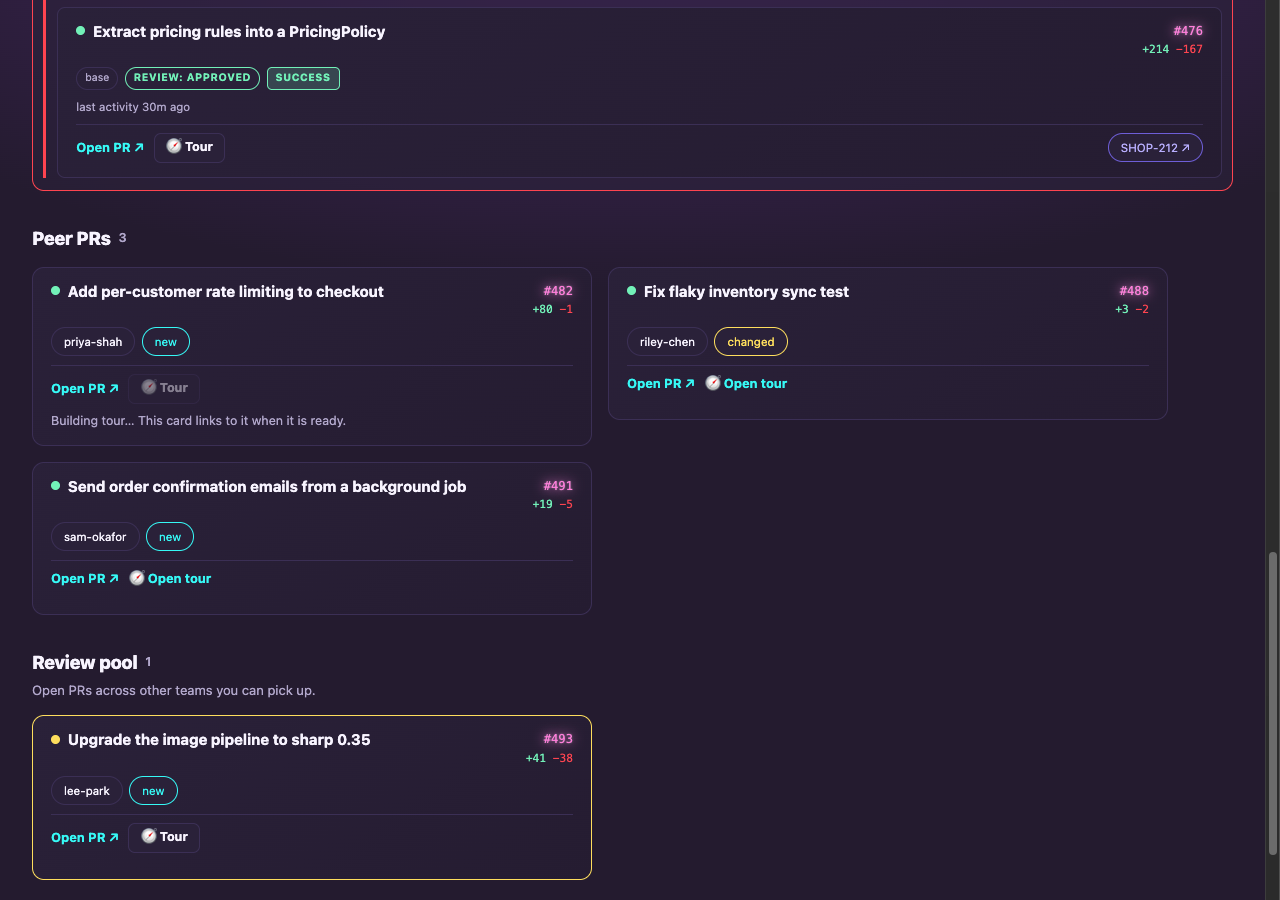
Every PR card has a 🧭 Tour button. Clicking it kicks off a build, and the card links to the tour when it's ready.
The tour opens as its own page. The overview says what the PR does and lists the stops:
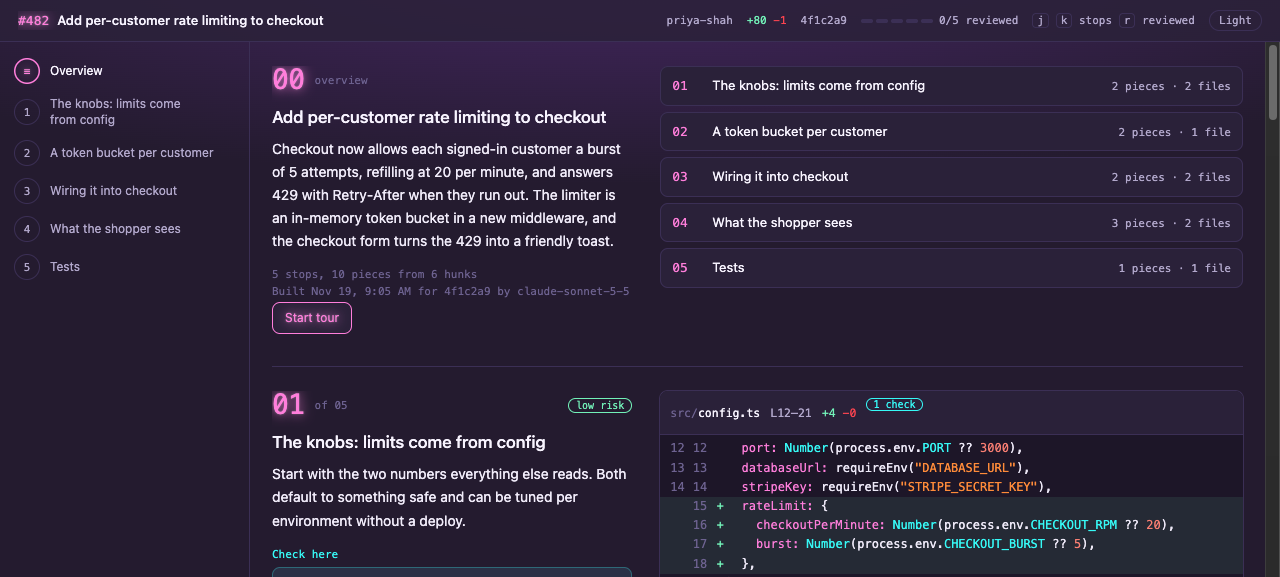
Each stop has a short narrative on the left and the slices of the diff it's about on the right, with "check here" notes pinned to specific lines and a low, medium, or high risk label. Changes get grouped so I get a flow and a feel for the PR, instead of a wall of diff.
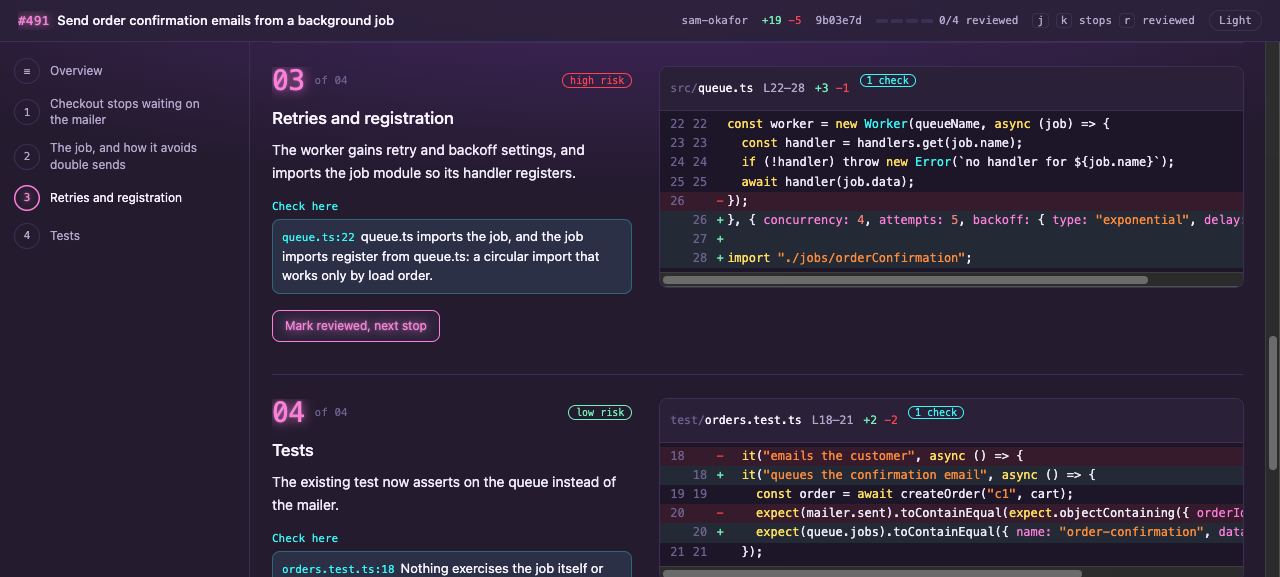
In the demo, the rate-limiting PR comes out as five stops, and rateLimit.ts shows up in three of them: the token bucket, then the middleware, then the 429 response, right next to the form code that reads it. One of the notes says nothing ever evicts from the bucket map, so it grows with every customer who checks out. That's the kind of thing I want to catch, and it's easy to miss on line 6 of a 45-line new file.
j and k move between stops, and r marks one reviewed.
I haven't added commenting yet. Leaving comments and sending a whole review from the tour is next. For now it's a visual way to get something close to Graphite.
How it fits together
The age of personal software is alive and well. I love working on tooling, and swamp lets me build these pieces over time as reusable components. Most of what went into the tour already existed, because I'd built it so agents wouldn't have to be retaught the same things over and over. Adding the tour was mostly adding pieces next to them:
model     pr-tour           gh fetches the PR, an agent writes the stops, code checks them
model     cli-agent         runs Claude (or another agent CLI) for any model that needs one
workflow  pr-tour           one step: pr-tour build for a PR number
report    pr-tour-report    renders the stored tour as one self-contained HTML page
webhook   /pr-hooks/pr-tour swamp serve runs the workflow on a signed POST
The rest of the dashboard works the same way. A scheduled workflow refreshes my PR feed, scans the board, prepares mechanical CI fixes, and drafts replies, and then a report renders the page. Every button is an HMAC-signed POST to a swamp serve webhook that runs another workflow. It all goes through swamp, so every piece is auditable, composable, and reusable.
The tour model does less magic than it looks like:
ghfetches the PR and its diff. The diff gets split into hunks, and every line gets a number.- An agent reads the PR in a read-only worktree at the head commit. It returns stops: each stop is a narrative, a risk level, and a list of line ranges inside hunks.
- Code checks the answer: every changed line must be placed exactly once. Lines can't go missing and can't show up twice. If the agent gets it wrong, it gets one retry with a list of the problems. If it's still wrong, the run fails instead of handing you a tour with holes in it.
- The report renders the page. The dashboard reads which tours exist for which commit and shows Tour, Building, Open tour, or "Older tour" when someone has pushed since.
Step 3 is the part I care about. The agent decides the story. Code decides whether the story covers the whole diff.
Nothing in the Tour reviews code automatically. I opt in, so I only spend tokens on a PR when I think it's worth reviewing that way. Everything else is deterministic. A tour does use some tokens, but it reuses what swamp already has. A tour is stored per commit, so opening it again costs nothing, and a new push marks the old one stale instead of throwing it away. It's a lot of little pieces coming together to make something bigger.
It's not a finished product. It helps with my own flows, I can change it any time I want, and I can share it.
Getting it running
The tour is published as @mgreten/pr-tour, and it works without my dashboard. You need swamp, gh logged in, a local checkout of the repo, and an agent CLI that's logged in. The agent can be Claude or anything else @mgreten/cli-agent supports, like Codex, opencode, Amp, or Gemini. From a swamp repo:
swamp extension pull @mgreten/pr-tour
swamp extension pull @mgreten/cli-agent

swamp model create @mgreten/cli-agent cli-agent
swamp model create @mgreten/pr-tour pr-tour \
  --global-arg repoSlug=your-org/your-repo \
  --global-arg repoPath=$HOME/code/your-repo \
  --global-arg agentProvider=claude \
  --global-arg pageBaseUrl=http://localhost:8765

swamp workflow run @mgreten/pr-tour --input prNumber=42
python3 -m http.server 8765 --bind 127.0.0.1 --directory ~/.pr-tour/pages
Open http://localhost:8765/42.html. A tour takes a few minutes on a mid-sized PR, and running it again for the same commit takes seconds.
To get a Tour button, turn on the webhook. Make a secret, then add one flag to swamp serve:
mkdir -p ~/.pr-tour && umask 077 && openssl rand -hex 32 > ~/.pr-tour/webhook-secret

swamp serve --host 127.0.0.1 --port 8899 \
  --webhook "/pr-tour:@mgreten/pr-tour:@file=$HOME/.pr-tour/webhook-secret:generic:X-PrTour-Signature:sha256="
Now anything that can send a POST of {"prNumber": 42}, signed with that secret, can request a tour. That could be a dashboard, a bookmarklet, or a script. The package's SETUP.md covers all of this step by step, and it's written so you can hand it to your agent and say "set this up for me." Colors are a theme setting, so you can restyle the page without forking it.
Some of the dashboard's other building blocks are published too: @mgreten/github-pr-feed pulls your open PRs and their state, @mgreten/github-stack handles GitHub stacks, and @mgreten/github-linear-sync links them to Linear.
The dashboard itself isn't published yet. It grew up around my work setup, with our test runner, our Linear wiring, and my tailnet. The plan is to split it the same way the tour went: a generic @mgreten/pr-triage with hooks for things like "how do I verify a fix," plus a private layer on top for the work-specific parts. Until then, the webhook is the seam. Whatever dashboard you already have can get a Tour button with one signed POST.